Plant status:
This widget shows in the dashboard the status of the plant in real time. By clicking on the button ‘State Plant’ it will be possible to place the widget on the work area.
Customize: you can decide whether to display the writing, change the background color, change the font or show a border. You can also move the object by setting the x and y coordinates precisely, bring it to the foreground or below another object, as well as make it transparent, align with others, duplicate and delete it.

Plant refresh:
This widget allows you to add a button to the dashboard that, once pressed, activates the update of the status of all variables of the plant.. By clicking on the button ‘Refresh Plant’ you can place the widget on the work area.
Customize: as with all widgets, you can also position this object precisely on the work surface by setting the x and y coordinates, bring it to the foreground or below another object, besides being able to make it transparent, align it with others, Duplicate and delete.

Last sampling:
This widget shows the date and time of the last plant data sampling available in the database. By clicking on the button ‘Last Camp.’ it will be possible to place the widget on the work area.
Customize: You can change the writing as you like, change the background color, change the font. You can also move the object by setting the x and y coordinates precisely, bring it to the foreground or below another object, as well as make it transparent, align with others, duplicate and delete it.
Plant name:
This widget shows the name of the plant. By clicking on the button ‘Title Plant’ it will be possible to place the widget on the work area.
Customize: you can change the background color and change the font. You can also move the object by setting the x and y coordinates precisely, bring it to the foreground or below another object, as well as make it transparent, align with others, duplicate and delete it.

Label:
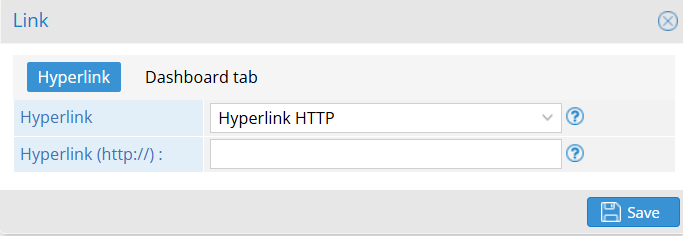
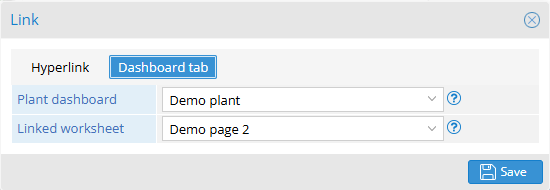
This widget allows you to insert free text and make that text a link to another external site or dashboard sheet. By clicking on the ‘Label’ button you can place the widget on the work area and by right-clicking on the widget you can configure it.
Customize: you can change the writing to your liking, change the background color, change the font, move the object by setting the x and y coordinates precisely, bring it in the foreground or below another object, as well as make it transparent, to align it with others, duplicate and delete it.
Tags (read/write):
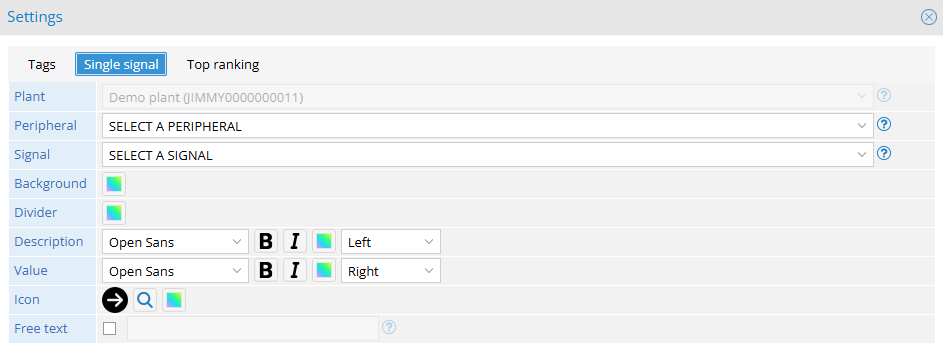
This widget allows you to use the signals of the plant to display them in various ways. By clicking on the button ‘Signals (read/write)’ you can place the widget on the work area and by right-clicking on the widget you can configure it.
Single signal: in this case only one signal will be displayed and it will be possible to configure the background, the divider, the font and the color of the description of the signal, the font and the color of its value, the icon with which it will be displayed and its color.
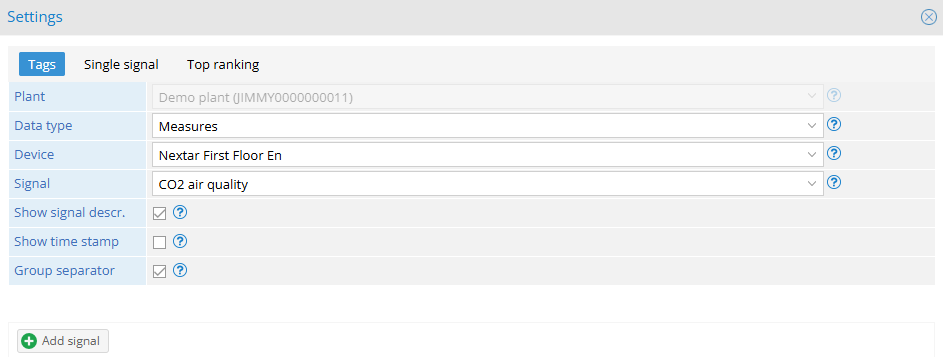
Tags: In this case, we can take multiple signals to display them in a single table where we can change the font, background and whether or not there are borders. The signals can be of 4 types:
Measures: simple values that will be represented in a table.
Alarms: alarm signals, in the table will be shown whether an alarm is active at that time or not.
SetPoint: A table where I can change the signal values in real time.
Status: used for digital signals, it allows you to see the state of each signal (you can choose size and color of the led shown next to the signal).
NB: The signals we will insert in the table must be of the same nature (all alarms, all SetPoints, all measurements or all status)
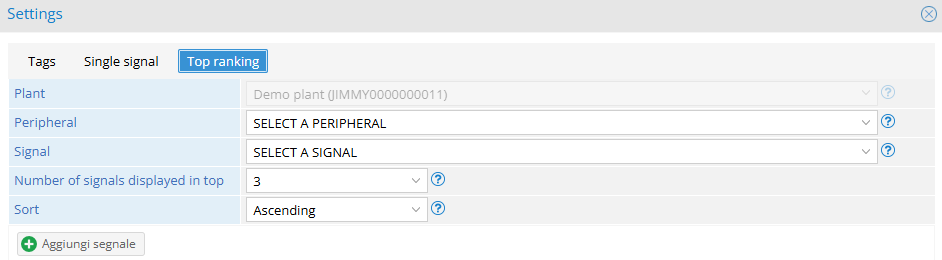
Top ranking: In this case you can select multiple signals and sort them in ascending or descending order (based on their value), also choosing the number of signals that will be displayed after sorting.
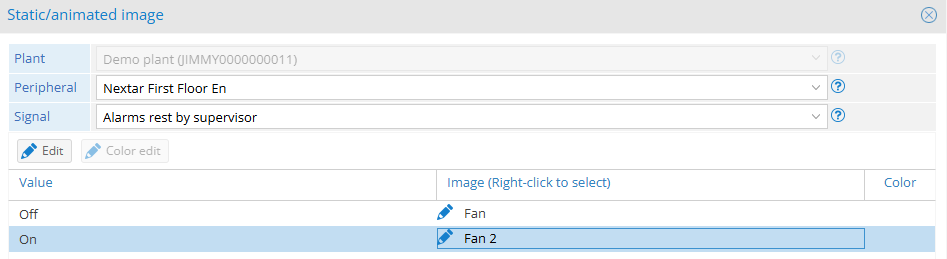
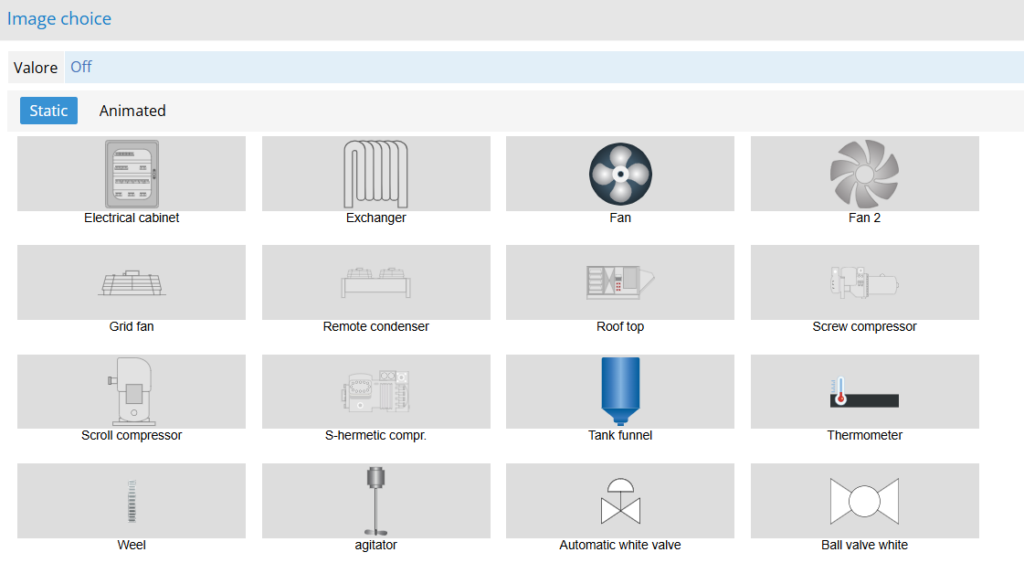
Images library:
This widget allows you to insert in the dashboard static or animated images that can be associated with the on/off values of the signal or its states, or free images (not linked to any signal). By clicking on the ‘Image library’ button you can place the widget on the work area and by right-clicking on the widget you can configure it.
Customize: From the widget configuration you can access the image library and make the association between the image and the signal.
Image/logo:
This widget allows you to add an image from your device to the dashboard.
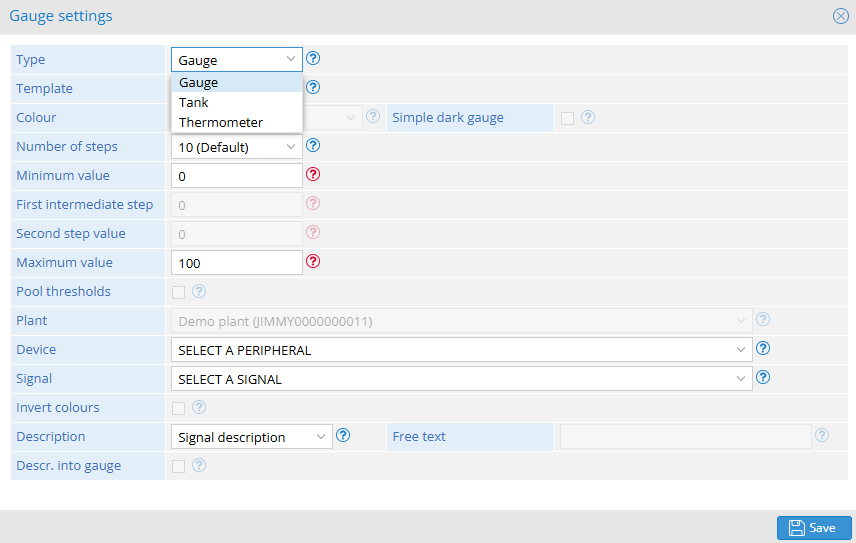
Gauge and tank:
This widget allows you to add an indicator to the dashboard and the indicator can be a: Gauge, Tank, Thermometer. By clicking on the button “Gauge and tank” you can place the widget on the work area and by right-clicking it will be possible to configure it.
Customize: you can choose the style that you prefer: colorful, technical and simple.
You can decide the number of steps, set a minimum value, a first and second intermediate step and a maximum value based on the device and signal.
Tank and thermometer
For the tank, in addition to the default, you can choose between these types: pool, closed pool and convex pool. Both for the tank and for the thermometer you need to set a minimum value and a maximum value based on the device and signal, also you can choose whether to show the thresholds.
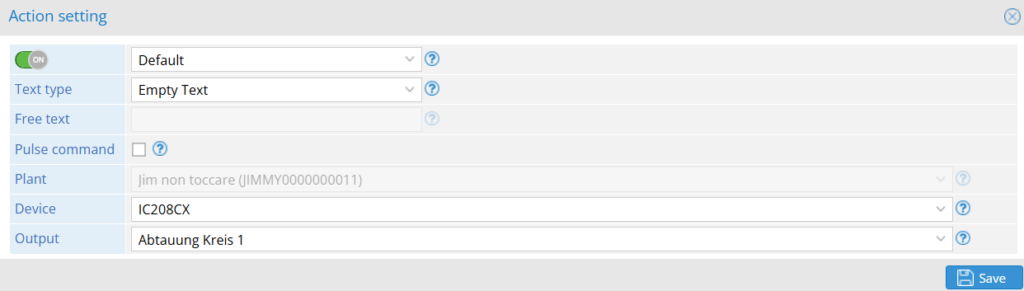
Command:
This widget allows you to add a command to the dashboard, choosing the device, the output to associate and the graphic style of the most suitable button to display. It is also possible to insert a command by impulse, remove the description or insert free text. By clicking on the button ‘Operation’ you can place the widget on the work area and by right-clicking on the widget you can configure it.
Three-state button:
This widget allows you to write parameter signals directly from the dashboard, assigning each button a different state. By clicking on the button ‘Three states’ you can place the widget on the work area and by right-clicking on the widget you can configure it.
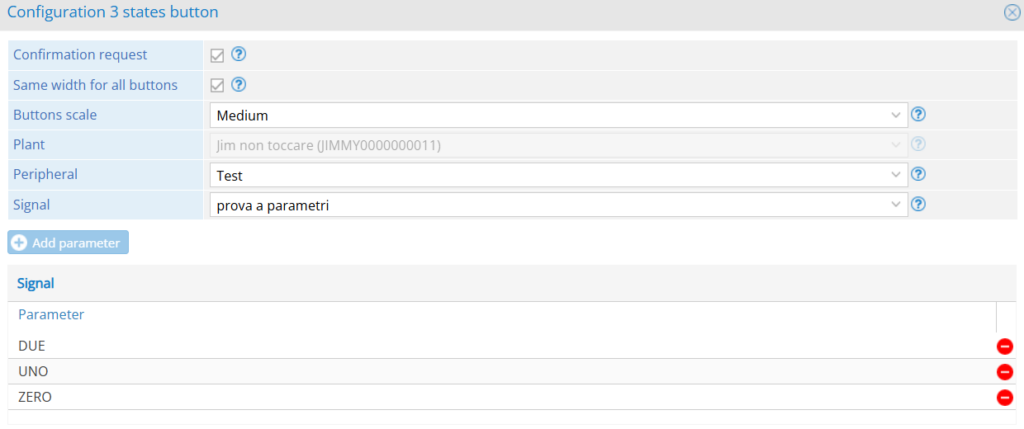
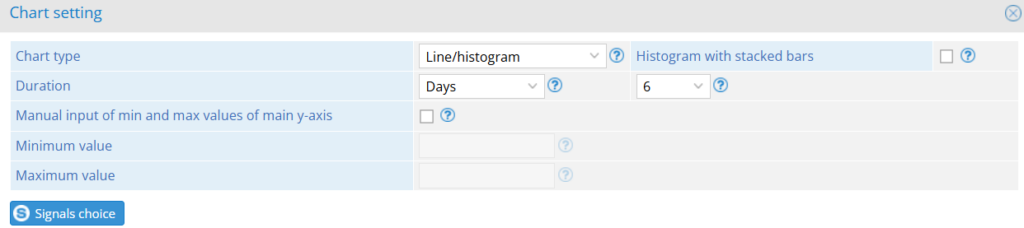
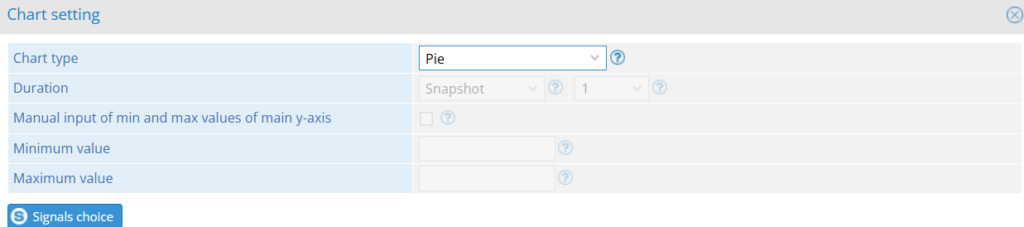
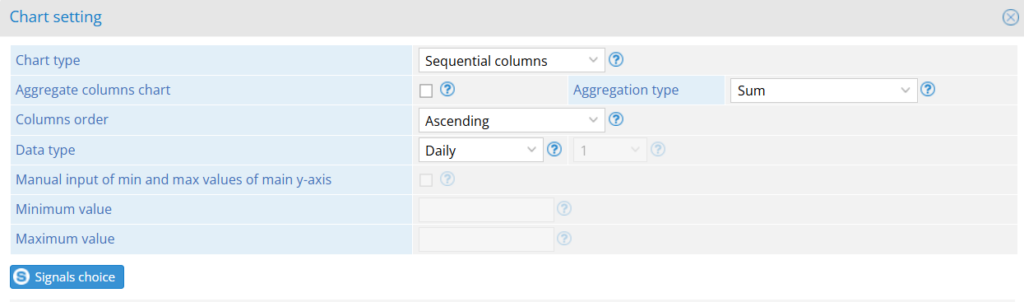
Chart:
This widget allows to represent the signals through 3 different types of charts, also allowing the choice of the time period taken into account to create them. By clicking on the ‘Chart’ button you can place the widget on the work area and by right-clicking on the widget you can configure it.
Line/Histogram: In this case you can also specify the minimum and maximum value.
Pie and 3D Pie: In this case just add the signals and they will be represented as a percentage next to the pie chart.
Sequential columns: In this case you can choose whether to have an aggregated graph by time period for sum or average, also it is possible to order the columns in ascending or descending order and the time period from which to take the data (daily, weekly, monthly or annual).
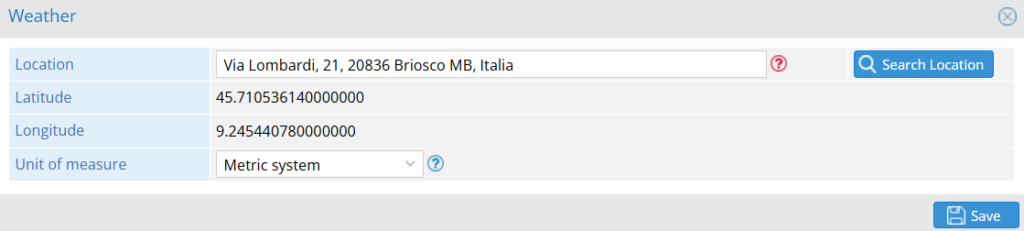
Weather:
This widget allows you to show the weather of any city in the world. By clicking on the ‘Weather’ button you can place the widget on the work area and by right-clicking on the widget you can configure it.
The widget will show in real time the temperature, humidity, sky condition, pressure, direction and wind strength of the selected location.
Warnings log:
This widget allows you to view the last 30 anomalies of the plant on which the dashboard is made. By clicking on the ‘Log anomalies’ button you can place the widget on the work area.
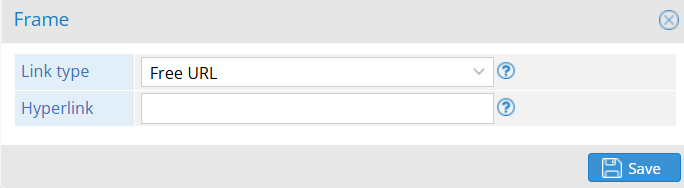
Frame/Map:
This widget allows you to insert a frame in the dashboard where you can show either the web interface of the monitored device or the map of the facilities, also you can specify an external domain to Rilheva using “generic URL” and the box “Hyperlink”. By clicking on the ‘Frame/Map’ button you can place the widget on the work area and by right-clicking on the widget you can configure it.
Date picker:
This tool allows you to choose the time range of the data that charts and tables will show in the dashboard.

Was this helpful?
0 / 0