What is the Historical?
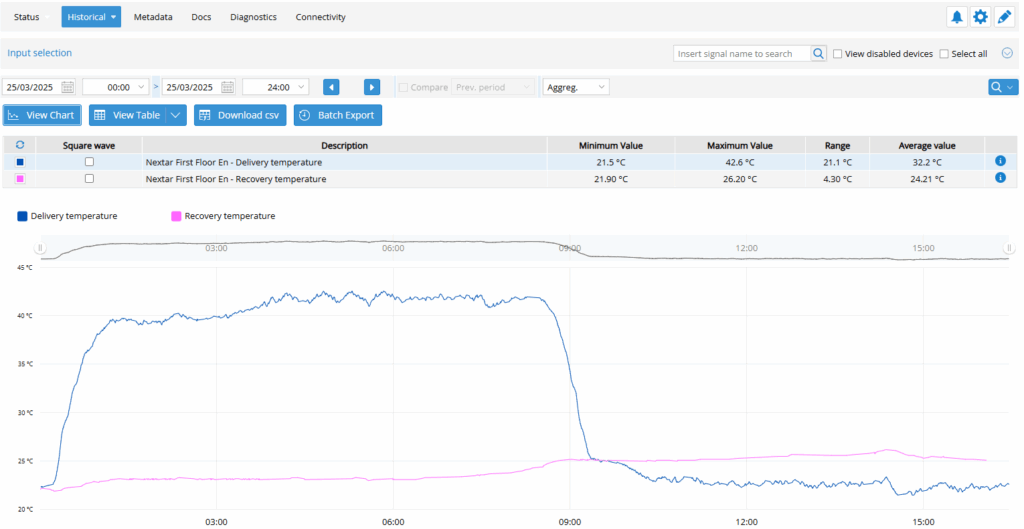
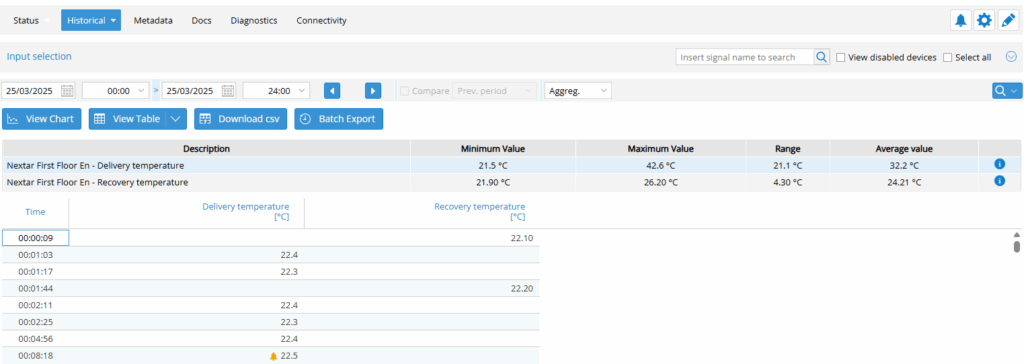
The History section allows you to view the data related to a plant in the form of a table, graph or exportable Excel file. You can also specify the time interval to be analyzed, so that you can search for data based on a period of interest.
Examples:
How to access the historical page
To access the historical page, once you have chosen the desired plant, simply click on the “History” button in the upper left:

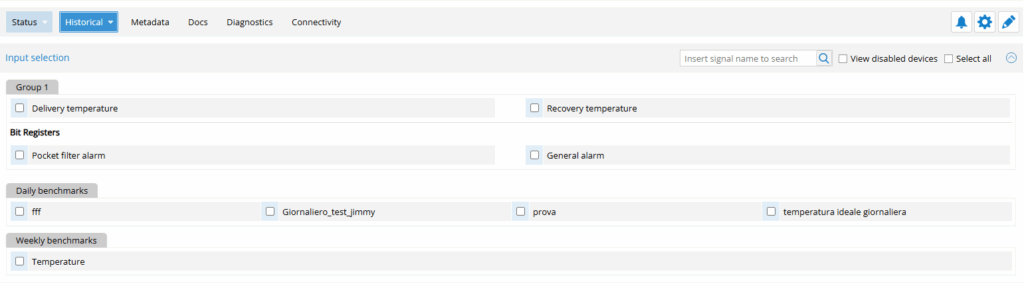
How do I select the signals and benchmarks that I want to see?
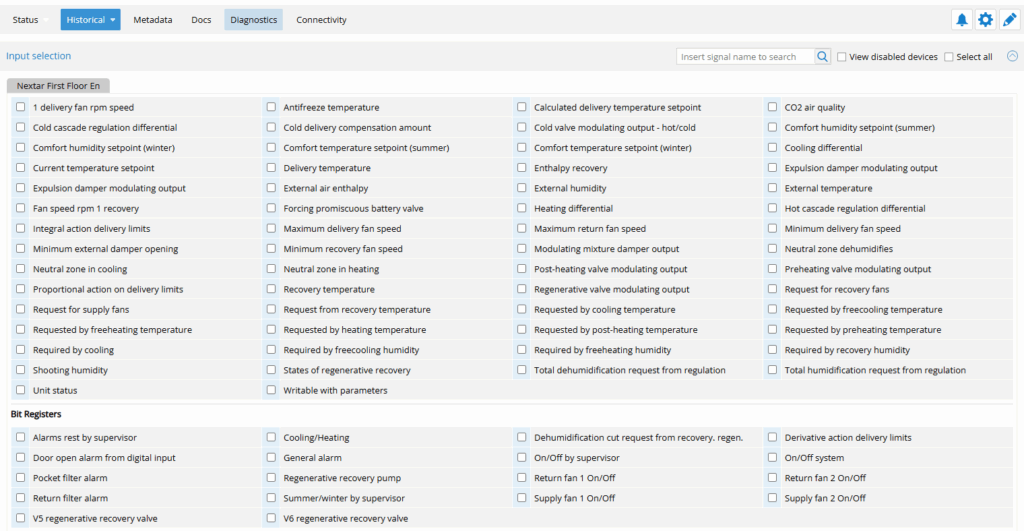
The selection of signals or benchmarks to be displayed is done through the Input Selection section. In this area you can:
- Also include signals from disabled devices.
- Search for signals by name.
- Select them individually or all by the appropriate checkbox.

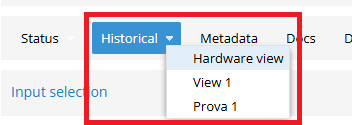
In addition, by clicking on the arrow next to “Historical” (top left), you can apply a custom view. This allows you to filter and display only a subset of signals, greatly simplifying the selection, especially in plants with a high number of inputs.
Example without custom view:
Example with custom view:
Was this helpful?
0 / 0