Configuration and visualization
To access the configuration of the dashboard you will need to click on the “Tools” button located in the top bar.

Then simply click on the “Dashboard” button, under “Utility”, to access the dashboard configuration page.
Once inside the configuration page you can create a dashboard by clicking on the “New dashboard” button in the top right.
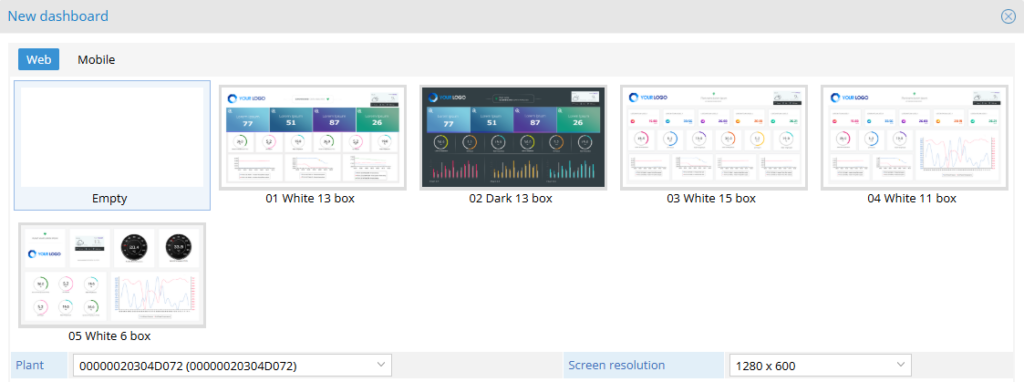
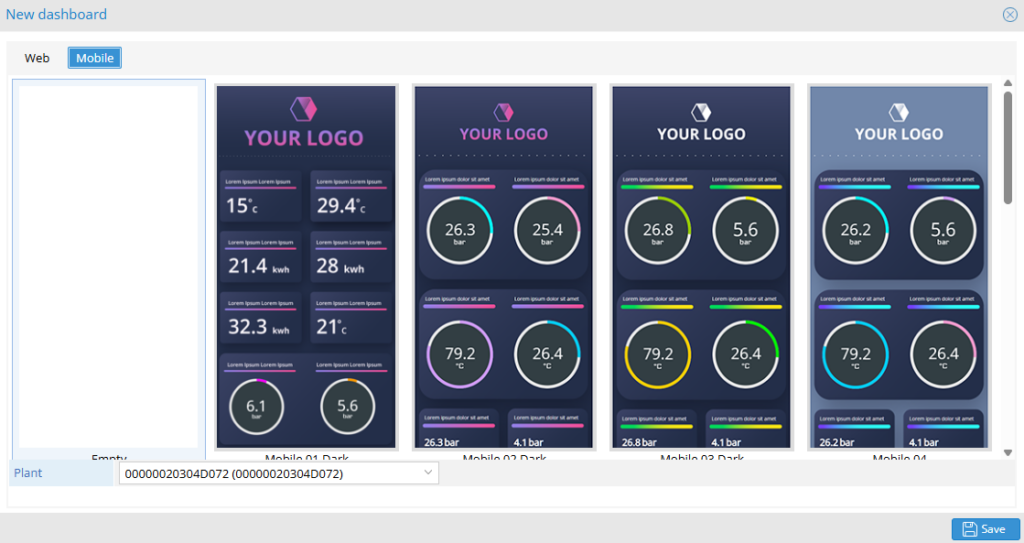
Finally, you will open an additional screen where you can choose whether the dashboard will be used on mobile or web, the resolution of the screen in the case of web dashboards, whether to use a starting template for the new dashboard and the plant on which it will be created.
NB: Only 1 user at a time can enter the configuration of a dashboard, also only users with configurator or higher permissions can create and configure a dashboard.
It will be possible to divide the dashboard into several pages and rename them as you like to make it easier and more effective at the same time, change background and duplicate pages.
Slideshow mode
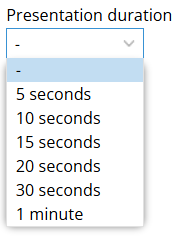
In addition, through the “presentation duration” button, located at the bottom right, it will be possible to change automatically the pages (tabs) with the checked checkbox “Presentation” according to the specified time interval.

Visualization
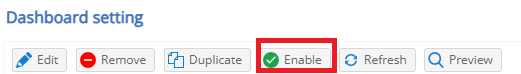
To view it, once created, you will need to select the desired dashboard and then click on the “enable” button in the dashboard configuration page.
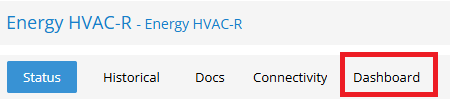
You can view the dashboard on the page of the plant on which it was created, by clicking on the “dashboard” button in the upper left.
Was this helpful?
1 / 0