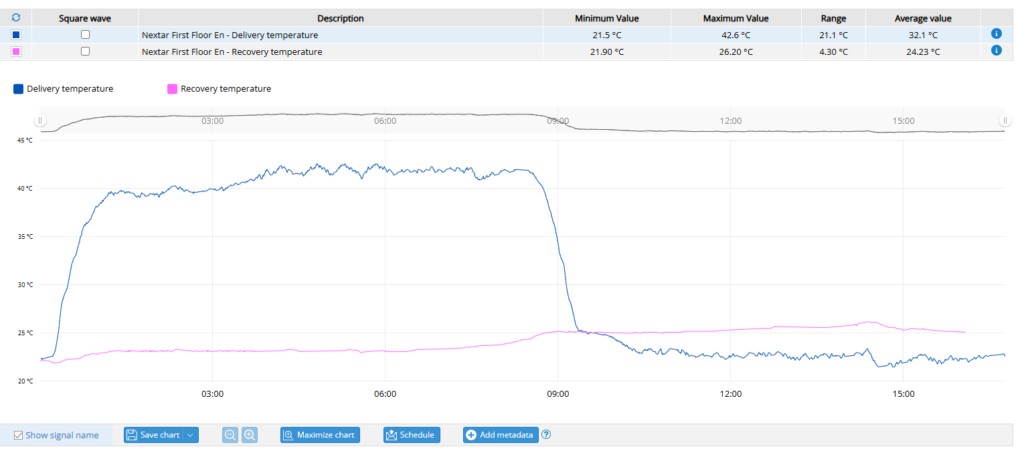
View chart
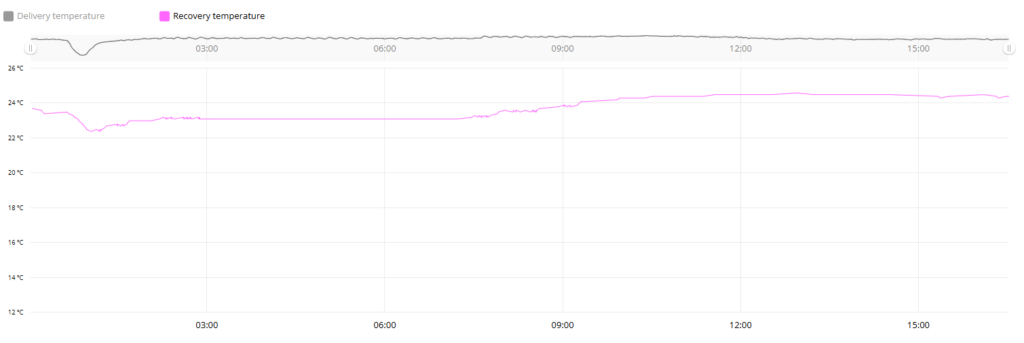
Thanks to this button it will be possible to display the selected signals within a chart composed of value and time:
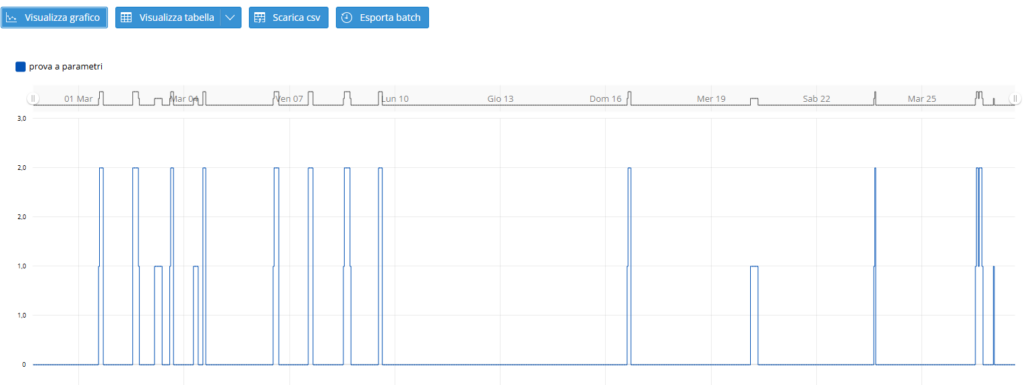
Example with parameter signal:
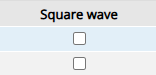
NB: Parameter signals will not appear in the summary table and will be shown as a square wave.
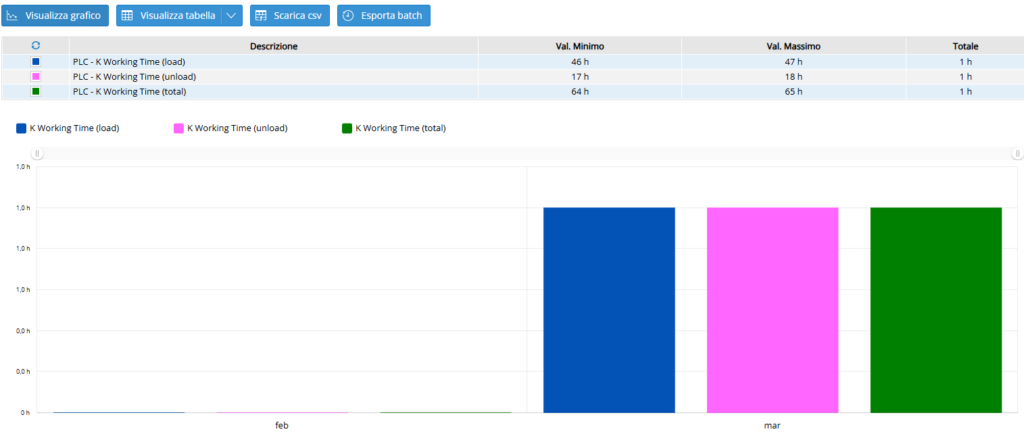
Example with counter signals:
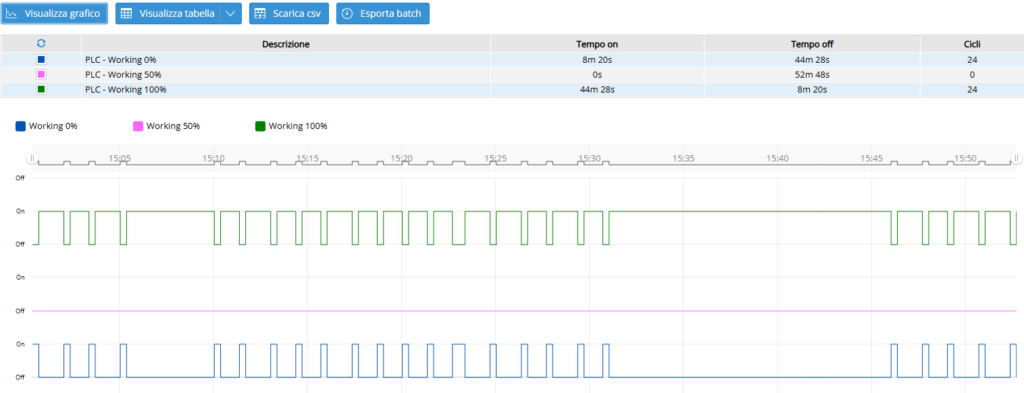
Example with digital signals:
NB: Digital signals are always represented as square wave, but it is possible to force the square wave display inside the signal configuration.
Functionalities
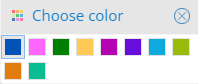
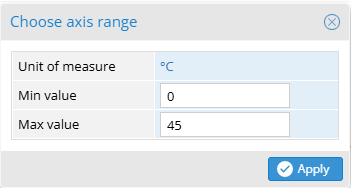
You can change the color of the lines of the signals by clicking on the color in the summary table, while by clicking on the vertical axis you can change its maximum and minimum value.
Signal display: by clicking on the name of the signal in the legend it will be possible to show or hide the signal from the chart.
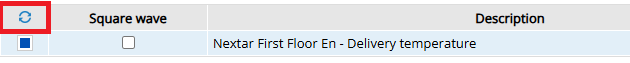
Refresh: when this button flashes it means that there is new data and you can press it to reload the updated data in the chart.
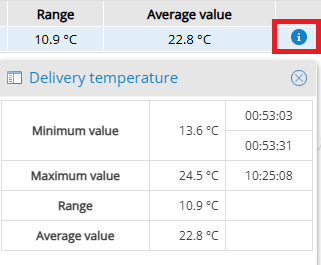
Info: this button shows a table with date and time of the minimum value and maximum value, the excursion and the average value.
Square wave: allows the signal to be displayed as a square wave.
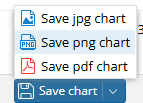
Save chart: allows you to save the chart as jpg, png or pdf.
Maximize chart: allows you to enlarge the chart to make it easier to understand. You can also zoom in on the chart by holding down the left mouse button and dragging to cover the desired part of the chart. Once you do this, just release the left button and the chart will enlarge and you can zoom in or out using magnifying lenses.
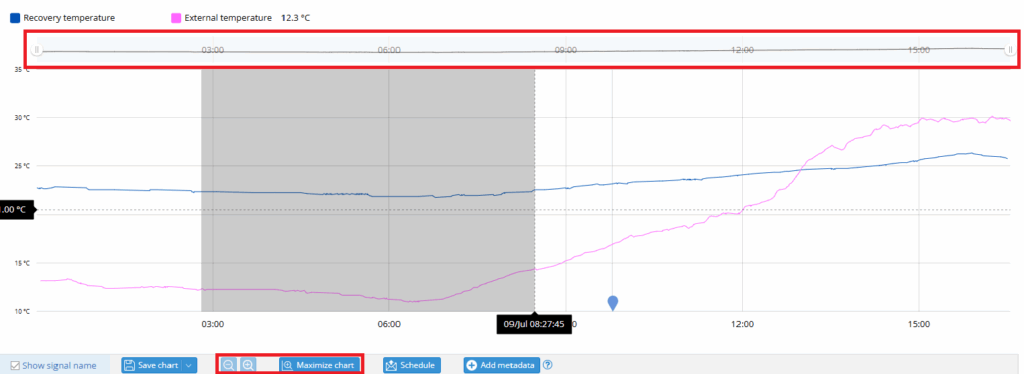
The bar at the top of the chart allows you to zoom in on the chart, while the + and – buttons at the bottom are only activated when you zoom. The – key is used to rewind a zoom, while the + key is used to return to the initial situation.
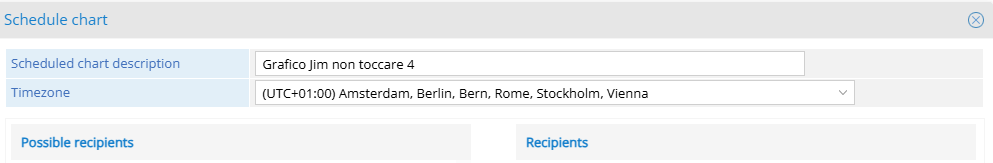
Schedule: allows you to schedule the sending of an email to multiple recipients containing the attached chart.

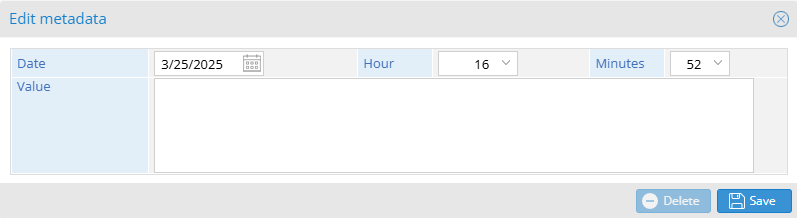
Add metadata: allows you to add a metadata at any point of the chart, specifying its value, date and time.
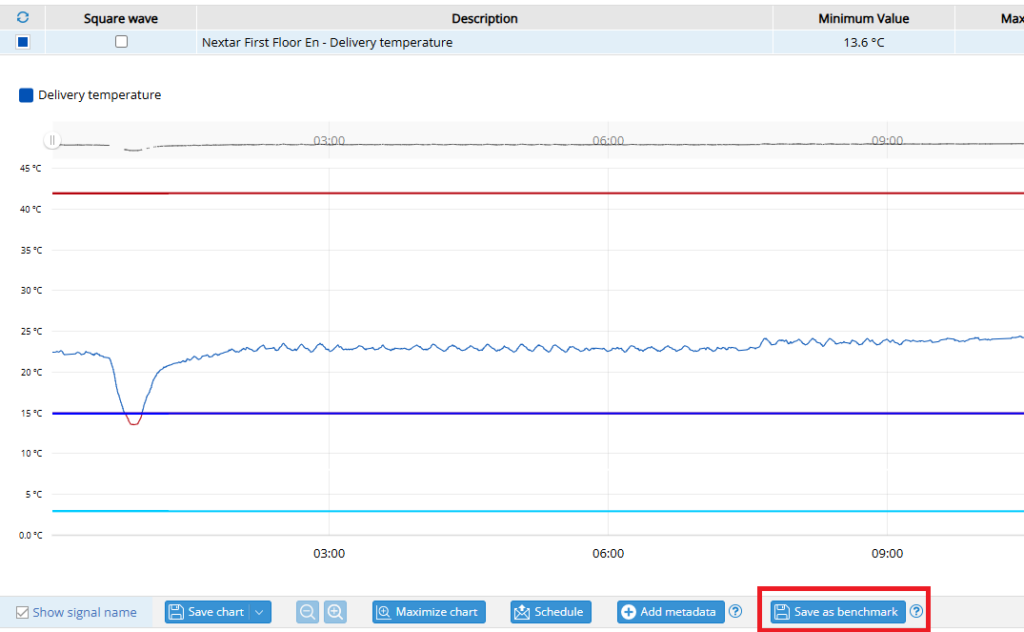
Save as benchmark: Only available if there is only one selected signal, it allows to save the selected signal as a benchmark, and then be able to compare it with other signals. The red line within the chart represents the maximum value, while the blue line represents the minimum value (both visible only if a single signal is selected).
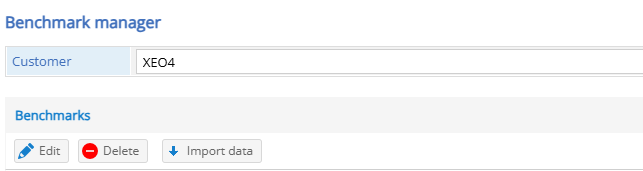
A dedicated section for benchmarks is available on the “Tools” page called “Benchmark configuration”:
Once inside the management page it will be possible to create (importing data from an excel file), delete and modify benchmarks:
NB: it is possible to save as benchmark the extraction of a single signal for only one day or seven days.
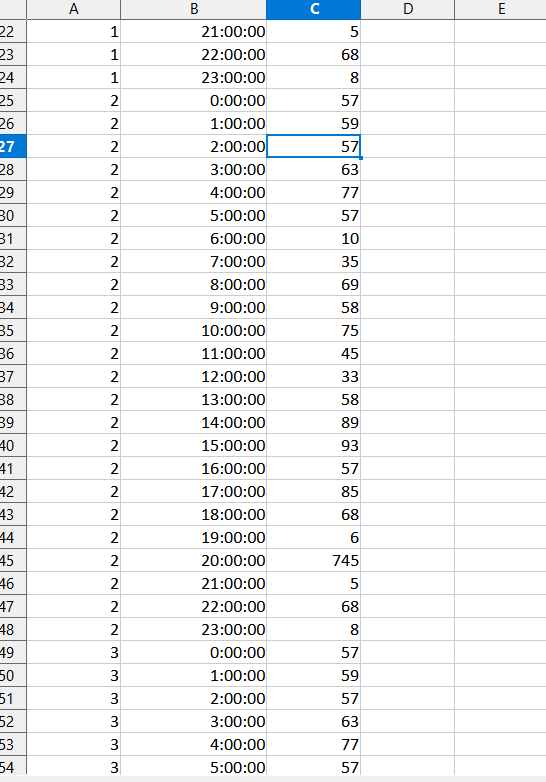
Weekly excel file:
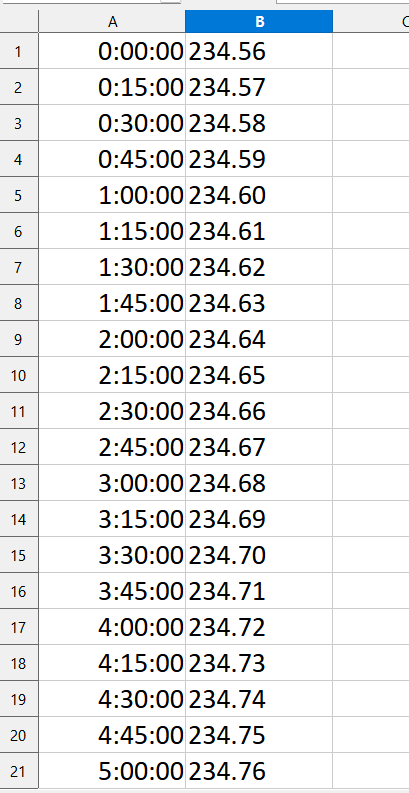
Daily excel file:
Was this helpful?
0 / 0